
Dashboard
The dashboard is the first screen after signing in. It summarises your whole company: what you created in a period, how much of your plan that has used, and what changed most recently.
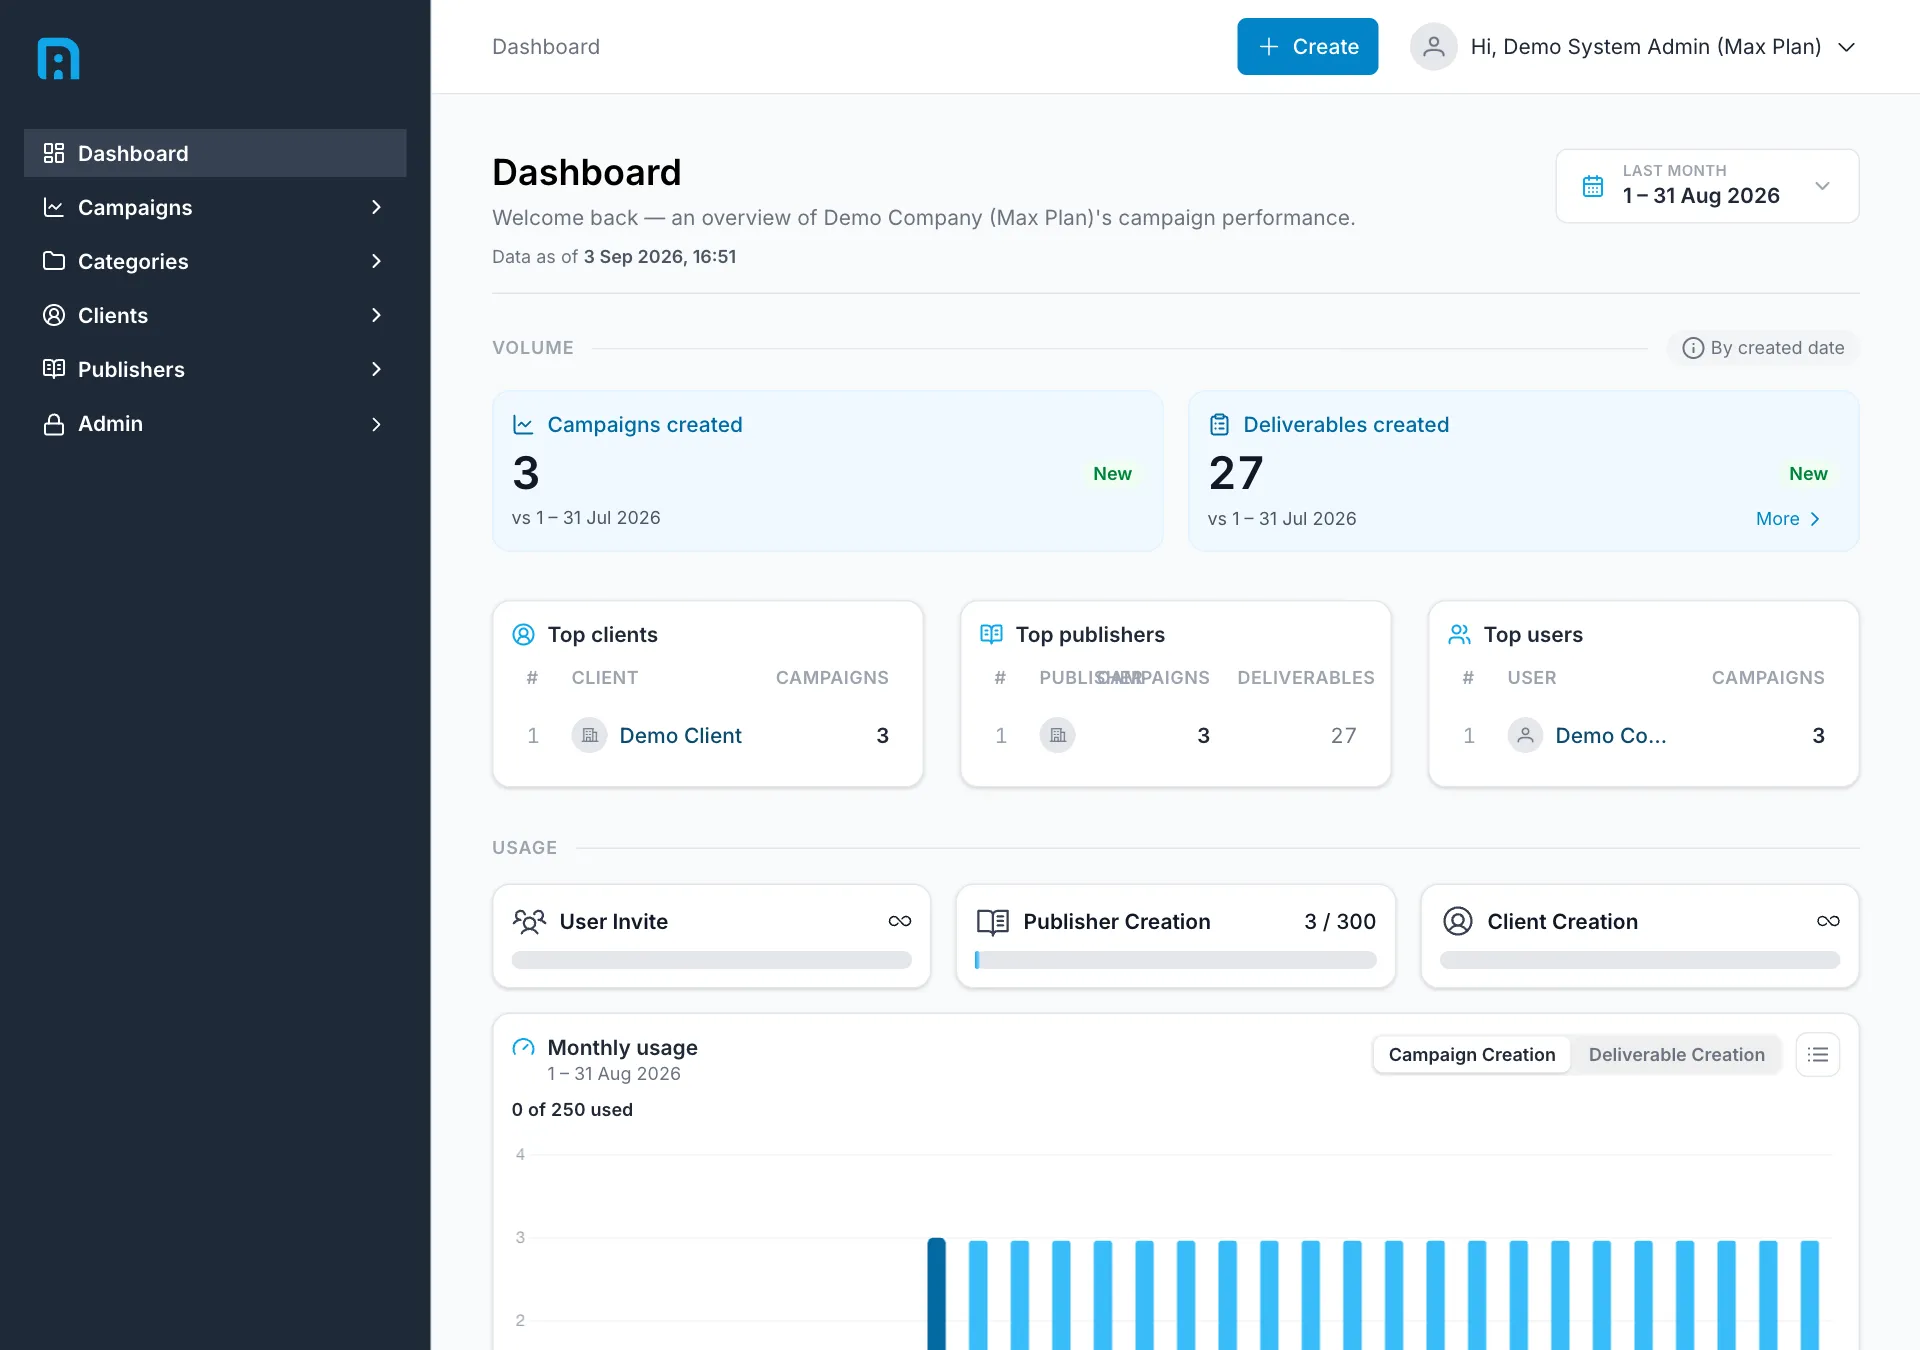
Two controls at the top govern everything below:
- The date-range selector (top right) sets the period the whole page reports on. It defaults to Last month and the chosen range is shown beneath it, for example 1 – 31 Aug 2026.
- “Data as of” under the title tells you when the figures were last refreshed. Everything on this page is as of that moment, not live — see Understanding your data.
Volume — what you created
Section titled “Volume — what you created”How much work was created in the selected period, counted by created date rather than by when content was published.
- Campaigns created and Deliverables created, each shown against the previous equivalent period (vs 1 – 31 Jul 2026) so you can see the direction of travel.
- Top clients, Top publishers and Top users — leaderboards ranking each by how many campaigns (and for publishers, deliverables) they account for in the period.
Together these answer “how much did we take on, and who did it involve”.
Usage — how much of your plan you have used
Section titled “Usage — how much of your plan you have used”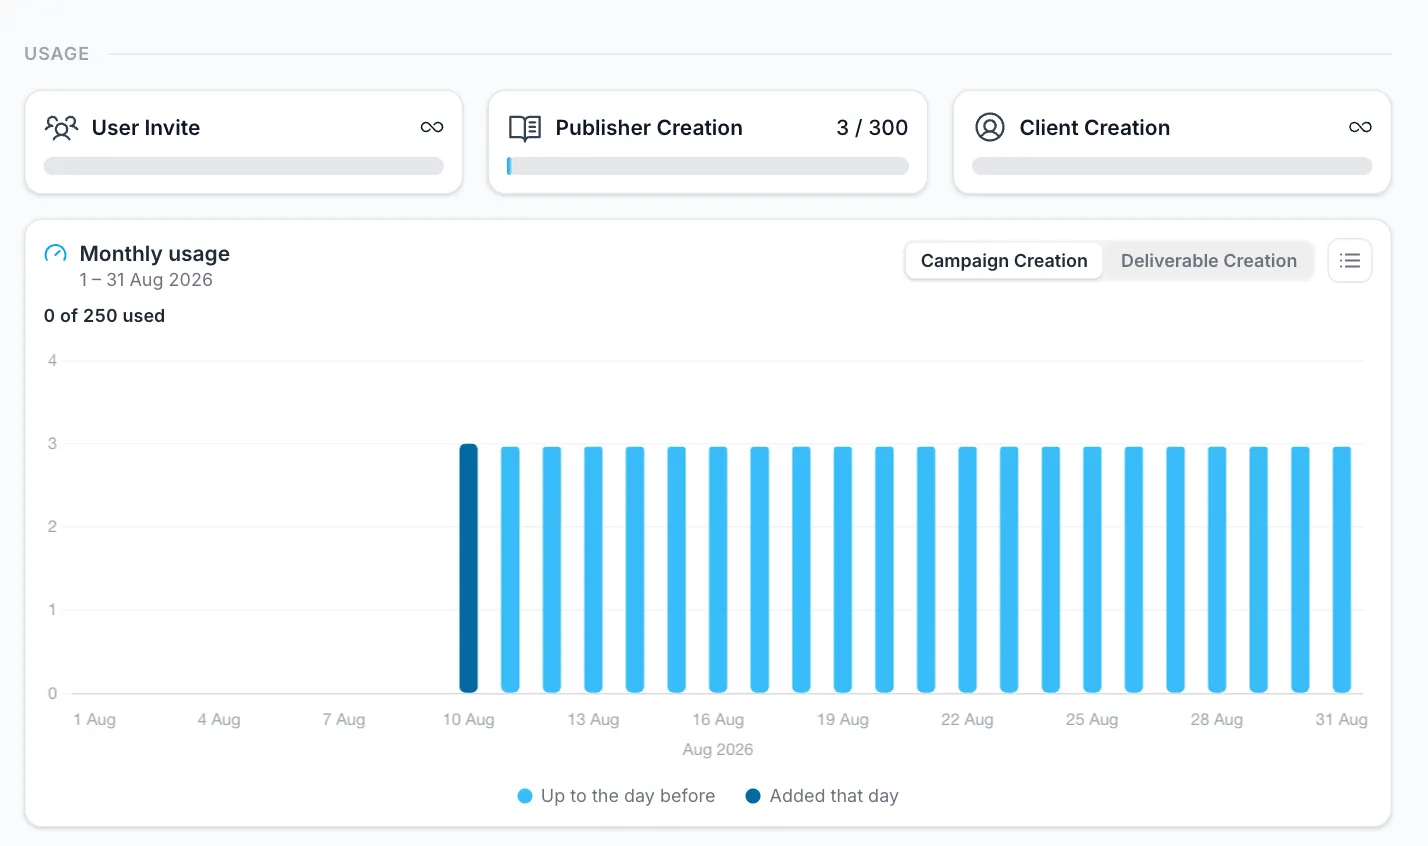
Each tile pairs a limit with your consumption of it — for example Publisher Creation 3 / 300. An infinity symbol (∞) means your plan sets no limit on that item.
Below them, Monthly usage charts creation across the month, switchable between Campaign Creation and Deliverable Creation, with a running total against your allowance (0 of 250 used). The two series separate what already existed from what was added on each day.
Recent activity — what changed lately
Section titled “Recent activity — what changed lately”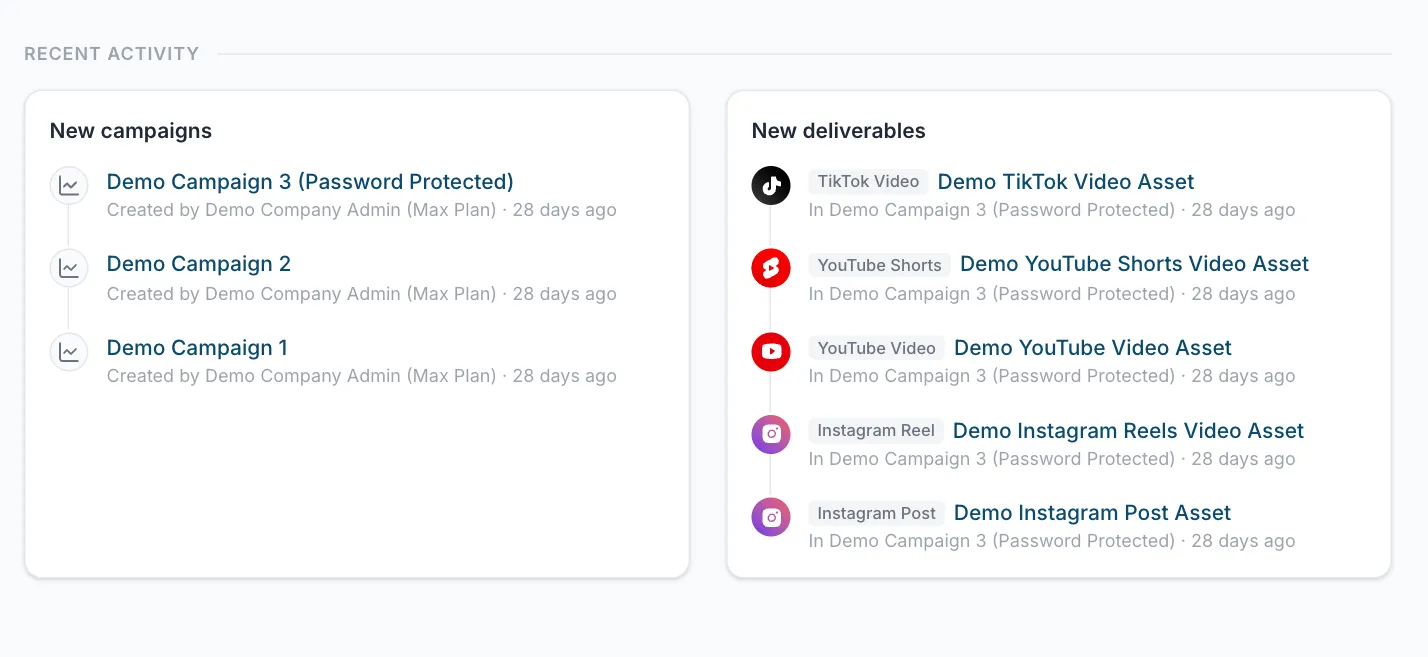
Two feeds of the newest items in your company:
- New campaigns — each with who created it and how long ago.
- New deliverables — each with its platform and type, the campaign it belongs to, and its age.
Every entry links straight to the item, which makes this the quickest route back to something you or a colleague was working on.
Related
Section titled “Related”- Understanding your data — why a figure may lag
- Campaigns — the per-campaign view